
Assignment 1:
Relating Two Functions f(x) and g(x)
by
Kristina Little
Assignment 1:
Relating Two Functions f(x) and g(x)
by
Kristina Little
Considering two functions f(x) and g(x). These two functions are shown on the graph.
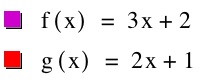
Now, we will show the relation h(x) = f(x) + g(x).
Collect like terms to arrive at the equation listed below.
![]()
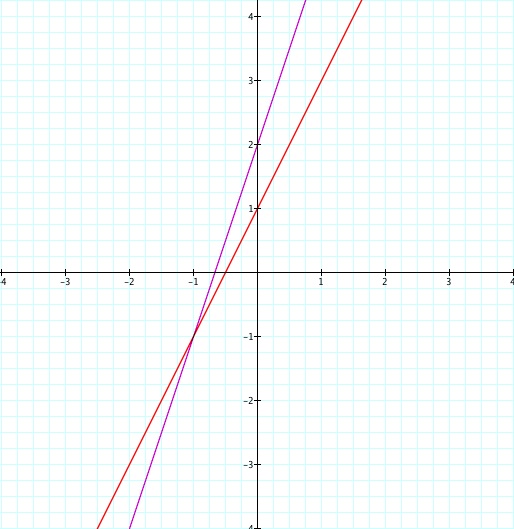
To the right is the graph of h(x).
Take note of the original slopes of f(x) and g(x). Adding the two functions together, we have created a whole new slope for h(x). From the equation of the line, we can easily pull the slope as 5 for h(x).
Also, the y-intercepts for f(x) and g(x) have combined to create a new intercept for h(x) as well. Looking at the graph and the equation, we can again label this point.
 Now consider h(x) = f(x)g(x).
![]()
![]()
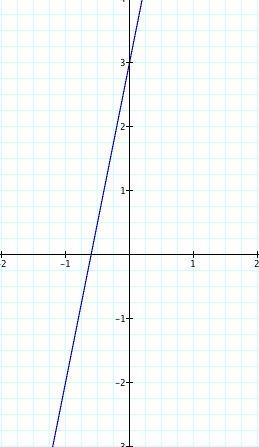
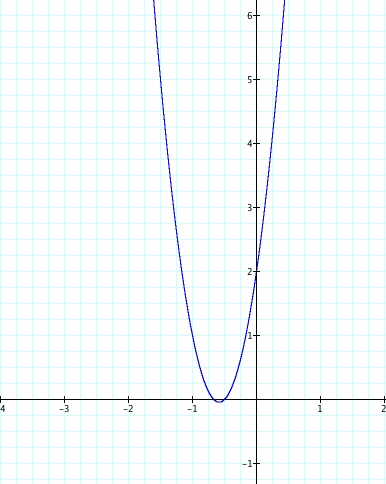
To the left is the new graph h(x).
Multiplying the two equations has completely transformed h(x) into a different classification of equation altogether. Since both f(x) and g(x) are linear functions, multiplying them together to create h(x) gives us at least one x squared. h(x) is now a parabolic graph.
One can use the quadractic formula to find the two places that the graph crosses the x-axis, or you can recognize that h(x) obviously factors into f(x) and g(x). This follows from h(x) being created from f(x)*g(x).
The y-intercept is then easily caculated by x=0 into h(x). So we have a good description of the parabola of h(x).
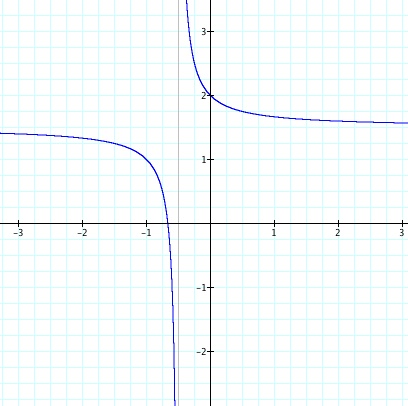
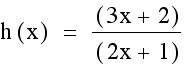
Let h(x) = f(x)/g(x).
A new graph follows.
We have seen the basic graph of 1/x. There is a point of dicontinuity where 2x + 1 = 0. Since the function h(x) is a quotient function, we cannot divide by zero, therefore the function is undefined at this point x = -1/2.
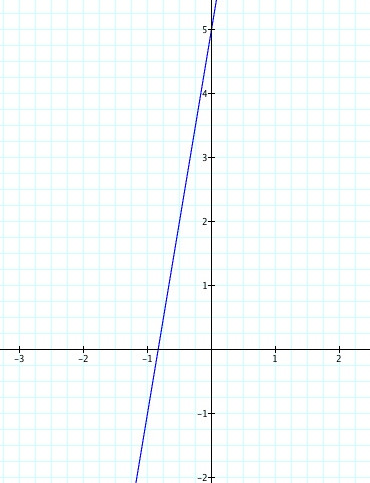
Finally let h(x) = f(g(x)).
![]()
To the right, we once more have a linear graph for h(x) since we are simply replacing one x for another to form a new equation. Using similar ideas to the first h(x) graph, we can see how the slope has once again changed realtive to the two original equations into something new.
We can also quickly plug in x=0 to find the y-intercept and have a very basic idea of the main properties of this new line we are seeing.
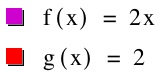
To further explore the patterns we are beginning to see, now let f(x) and g(x) be two new functions.
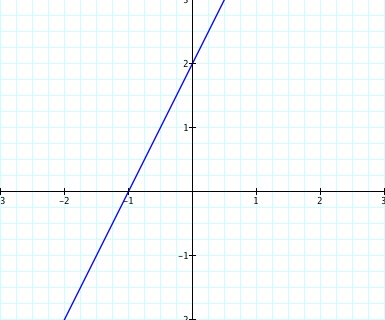
Now, we will show the relation h(x) = f(x) + g(x).
![]()
The graph once again shows a linear line. We can see from the orginial functions of f(x) and g(x) that f(x) has contributed the slope to the new line and g(x) has contributed the new y-intercept.
With these two changes, the line no longer goes through the origin but has moved to cross the x-axis at -1, which we can can easily solve h(x)=0 to prove this algebraically.
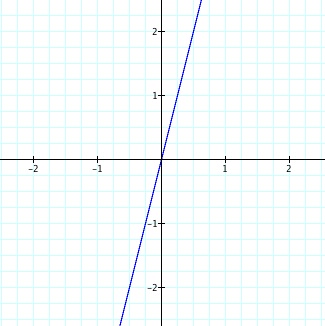
Now consider h(x) = f(x)g(x).
![]()
![]()
This graph, unlike the one directly above, does still go through the origin. We can infer this from the equation h(x) since there is no constant or variable added to originally f(x) equation.
Multiplying f(x) by g(x) ends up multiplying f(x) by 2, so the slope of f(x) changes by a factor of 2. In other words, the slope of h(x) is now 4. This higher slope makes h(x) steeper than f(x).
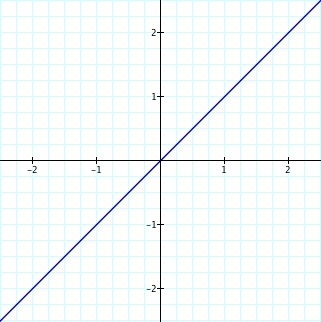 Let h(x) = f(x)/g(x).
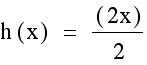
![]()
Using the oppostie operator from the immediate prior graph, instead of creating a steeper slope for h(x) from f(x) we decrease the slope. By dividing 2x by 2 we essentially cancel out the original slope, therefore all we are left with is the basic graph of h(x)=x. We can then see that the y-intercept will be the origin.
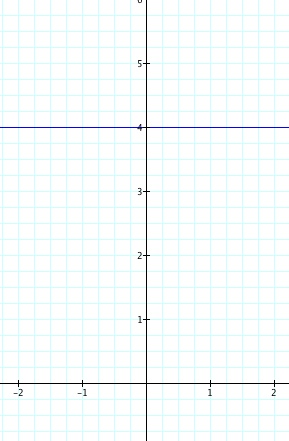
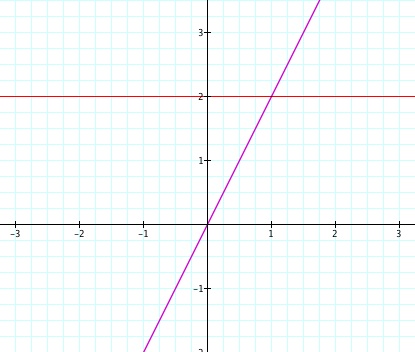
Finally let h(x) = f(g(x)).
![]()
The final graph that we compute today is not typical. Letting h(x) = f(g(x)), we are essentially let every value of x in f(x) equal 2 for all values of y. So with our new graph, h(x) = 4 (see above). This graph creates a horizontal line through the y-intercept of 4.
Feel free to continue exploring other graphs with the five translations above!
Assignment 2: Varying "a" of a Parabola